Related to:
Active Console is displaying grey. Active Console not working, no alerts showing
Problem
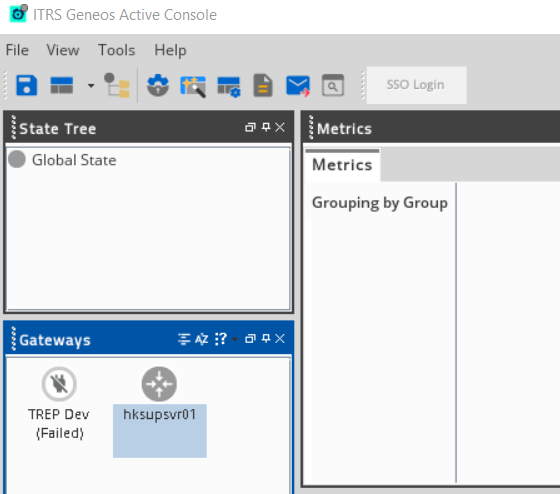
- My Gateway Icon is grey
- My Managed Entity is grey
- My Active Console Task bar icon is grey
- My Dataview is grey
Possible Causes
Root Cause 1 - Gateway(s) are disabled
- Gateway(s) has no Managed Entities defined
- All Managed Entities are snoozed
- There are no Severities defined in the Gateway(s) or no rules set up.
- All the netprobes are down on the Gateway(s)
Root Cause 2 -The Managed Entity is Snoozed
- There are no samplers defined in the Managed Entity
- There are no rules on any of the samplers in the Managed Entity
- There are no current severities on any of the samplers on the Managed Entity
- The samplers have been misconfigured
Root Cause 3 - The Use Paths for Severity checkbox is ticked in System Tray settings and the path defined evaluates to no severity being present
- The Use Paths xpath evaluates to a non existent target
Root Cause 4 - There is no dataview present
- There are no rules set on the dataview
- There are rules set but no current severities are currently being propagated.
- The sampler(s) are not correctly configured
Possible Solutions
Solution Root Cause 1 -
- Check the Gateway Icon in the Gateways view in the Active Console.
- If the Gateway Icon is a lighter shade of grey it is likely that it has been disabled.
- Right click the Gateway Icon in question and choose Connect to Gateway. Or go to Tools, Settings, Connections and ensure that the Enabled checkbox is ticked for the relevant Gateway
- If the Gateway Icon is a darker shade of grey this means the Gateway is Connected but either
- All severities are currently snoozed within the Gateway - Check the Managed Entities view or the Gateway-snoozeData Plugin for details
- There are no configured Entities within the Gateway - Click on the Gateway Icon and view the Managed Entities sectio in the Active Console to verify this.
- There are no currently severities being propagated within the Gateway - Check the Managed entities within the gateway and dataviews within in
- All NetProbes are disconnected or down - Check on the physiscal servers if there are issues with the netprobes.
Solution Root Cause 2 -
- Check the Managed Entity status in the Managed Entities view.
- If the Managed Entity is light grey in colour it is likely it has been snoozed.
- If the Managed Entity is dark grey in colour check it can mean either there are no severities currently present within the dataviews or that there are no current samplers present. There also might be the case of samplers misconfigured which can result in no dataview being present. The netprobe log file should be checked in this case.
Solution Root Cause 3 - Check the corresponding x-path defined does reflect the correct severity.
- Check that the x-path defined is valid.
Solution Root Cause 4 - Add samplers to the NetProbe / Managed Entity via the Gateway Setup Editor
- Check the NetProbe log file for any errors with regards to mis configured samplers
- Check x-paths are valid for any rules defined on dataviews.
If Issue Persists
- Please contact with our Client Services team via the chat service box available in any of our websites or via email to support@itrsgroup.com


- Make sure you provide to us:
- Screenshots of dataviews/ Active Console
- Gateway Diagnostics File
- ActiveConsole Diagnostic File
- NetProbe log file
- Any troubleshooting step already verified from the ones described in this article.

Comments
0 comments
Please sign in to leave a comment.