Related to:
OP5 GUI/UI unresponsive slow load time
Problem
- When browsing the GUI/UI of OP5, it takes a long time to load any pages.
Possible Cause(s)
- System not meeting minimum requirements for the amount of monitored devices the system is checking.
- High Disk I/O on server. Heavy disk I/O usage can cause slow down's and unresponsiveness in the OP5 product, which is an I/O heavy application.
- High CPU usage.
- High memory usage.
Possible Solution(s)
- Check and make sure that the machine (virtual or physical), meets or exceeds the recommendations for OP5, (which is dependent on the amount of monitored devices the server is checking). Please refer to the links below:
What are the minimal hardware requirements to run OP5 Monitor? - Install and run ist diagnose to get details on the status of your system.
- Try to restart services related to the UI to see if this helps improve responsiveness:
systemctl restart httpd lmd naemon
-
For troubleshooting Disk I/O, let's begin by installing the packages needed to look at, if they are not installed yet.
For CentOS/RHEL/Fedora flavors:
yum install -y sysstat iotop
The command to run would be:
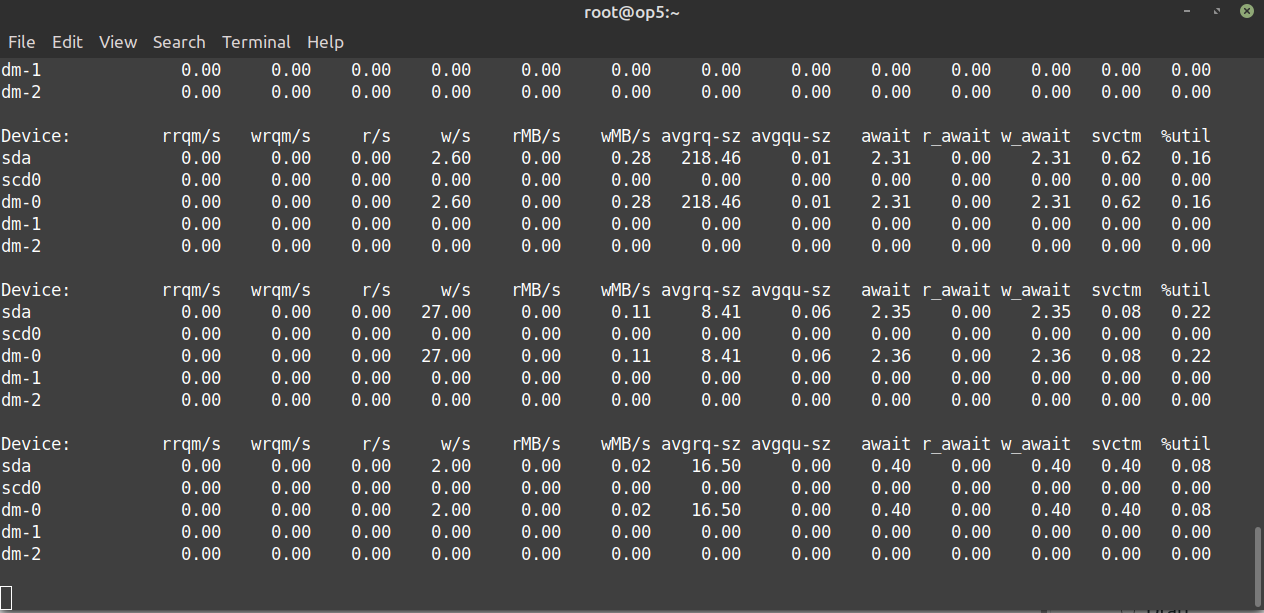
sudo iostat -dmx 5
This can be started by running the following command to see the disk I/O of each respective application real time:
This command gives you the output of disk I/O performance, reoccurring every 5 seconds. Look and see if there is any high disk I/O on the machine, including wait time. If there is, we need to start ruling out the causation of the high I/O.
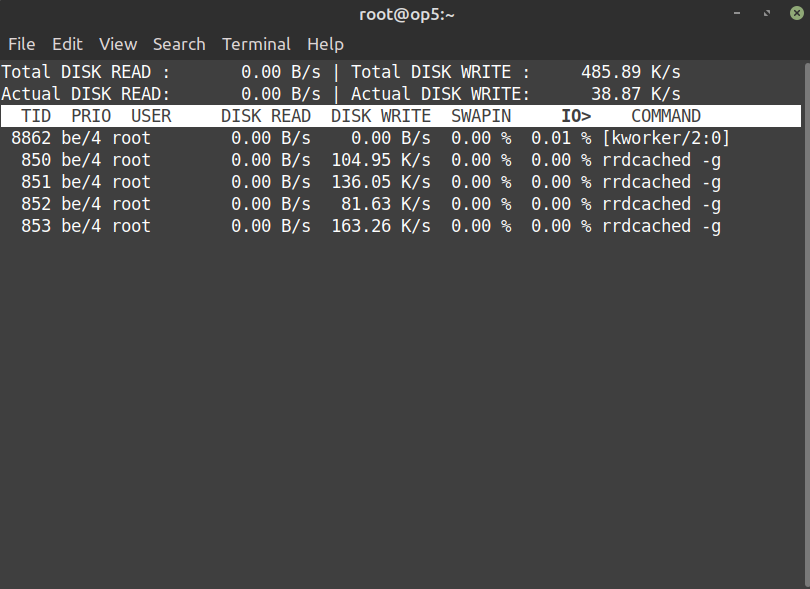
sudo iotop -o

This command shows real-time what application is accessing the drive (be it read or write), and the amount of data transferred. Further investigation would be needed on the application which is using so much disk I/O. A restart of the service in question may also rectify any erroneous behavior in an application, if this is believed to be the case, but this ultimately the decision of the systems administrator.
If it is intended disk usage, then a more robust storage solution may be in order for the OS.
If it is an OP5 application (such as merlin, naemon,etc), please contact support for us to help you on the issue. If it is another application in question (such as apache, postgres, mysql,) we can give limited support. - .For looking into possible high CPU usage, let's begin by installing the packages needed to look it, if they are not installed yet.
For CentOS/RHEL/Fedora flavors:
yum install -y sysstat htop
The first thing you would want to do is to check the current CPU usage of the system. To do this please run the following command:sudo mpstat
This will give your systems current CPU usage in a concise, one-time output:[root@op5 ~]# mpstat
Linux 3.10.0-1160.36.2.el7.x86_64 (op5.itrsgroup.local) 09/10/2021 _x86_64_ (4 CPU)
12:02:37 PM CPU %usr %nice %sys %iowait %irq %soft %steal %guest %gnice %idle
12:02:37 PM all 1.72 0.00 0.35 0.02 0.00 0.01 0.00 0.00 0.00 97.90
[root@op5 ~]#Looking into the output, if your %iowait is high, and your %idle is low, then there is a good chance you have high CPU usage. Let's see if if we can find which application is doing this.
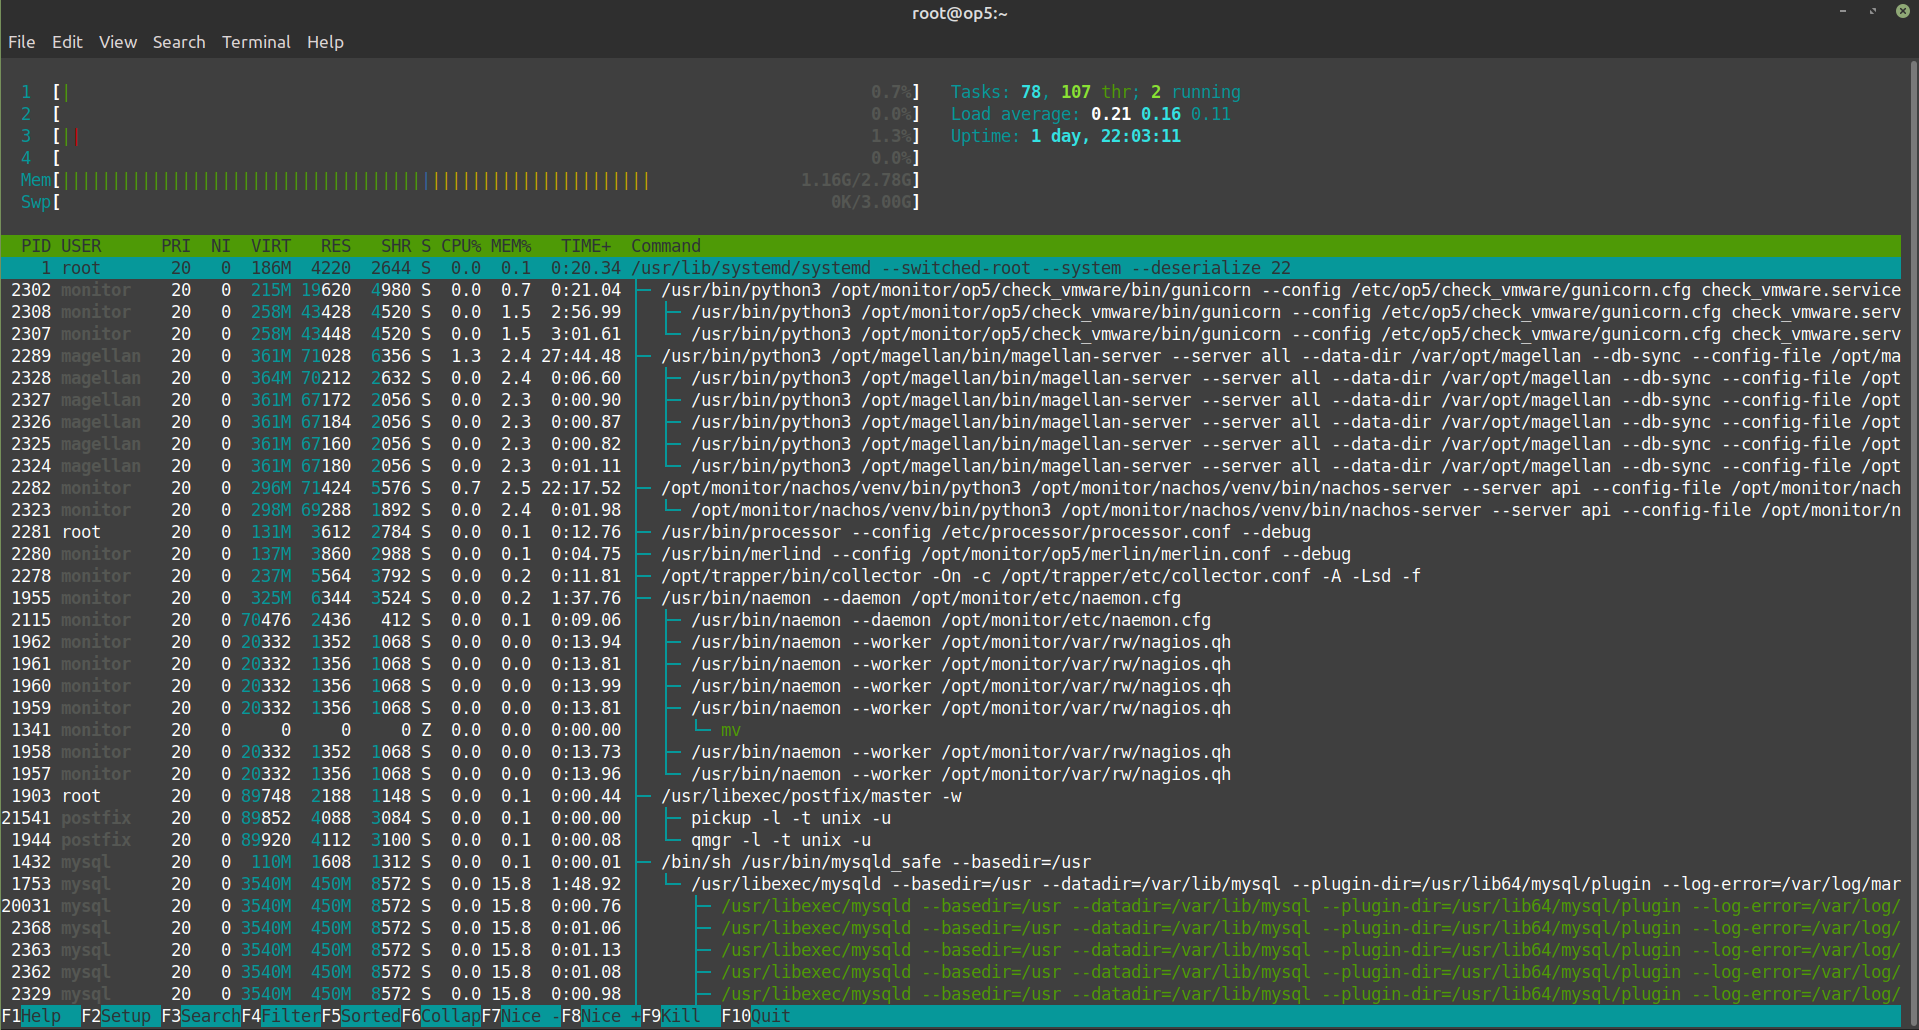
The command you would then want to run would be:htop
After running this command, if you press F5, it will sort all PID's:
Use the up and down arrows to browse the PID's, looking in the CPU% column for the offending application. A restart of the service in question may also rectify any erroneous behavior in an application, if this is believed to be the case, but this ultimately the decision of the systems administrator.
If it is intended CPU usage, then a more robust processor solution may be in order for the OS.
If it is an OP5 application (such as merlin, naemon,etc), please contact support for us to help you on the issue. If it is another application in question (such as apache, postgres, mysql,) we can give limited support. - For troubleshooting Memory, you can see how much memory and which application using the most memory by using the htop command:
htop

As you can see in the picture above, there is a column dealing with memory usage, and the total memory usage is shown on top.
Use the up and down arrows to browse the PID's, looking in the Memory Usage column for the offending application. A restart of the service in question may also rectify any erroneous behavior in an application, if this is believed to be the case, but this ultimately the decision of the systems administrator.
If it is intended memory usage, then adding more memory may be needed in the near future. for the OS.
If it is an OP5 application (such as merlin, naemon,etc), please contact support for us to help you on the issue. If it is another application in question (such as apache, postgres, mysql,) we can give limited support.
If Issue Persists
- Please contact with our Client Services team via the chat service box available in any of our websites or via email to support@itrsgroup.com


- Make sure you provide to us:
-Any troubleshooting step already verified from the ones described in this article.
Comments
0 comments
Please sign in to leave a comment.