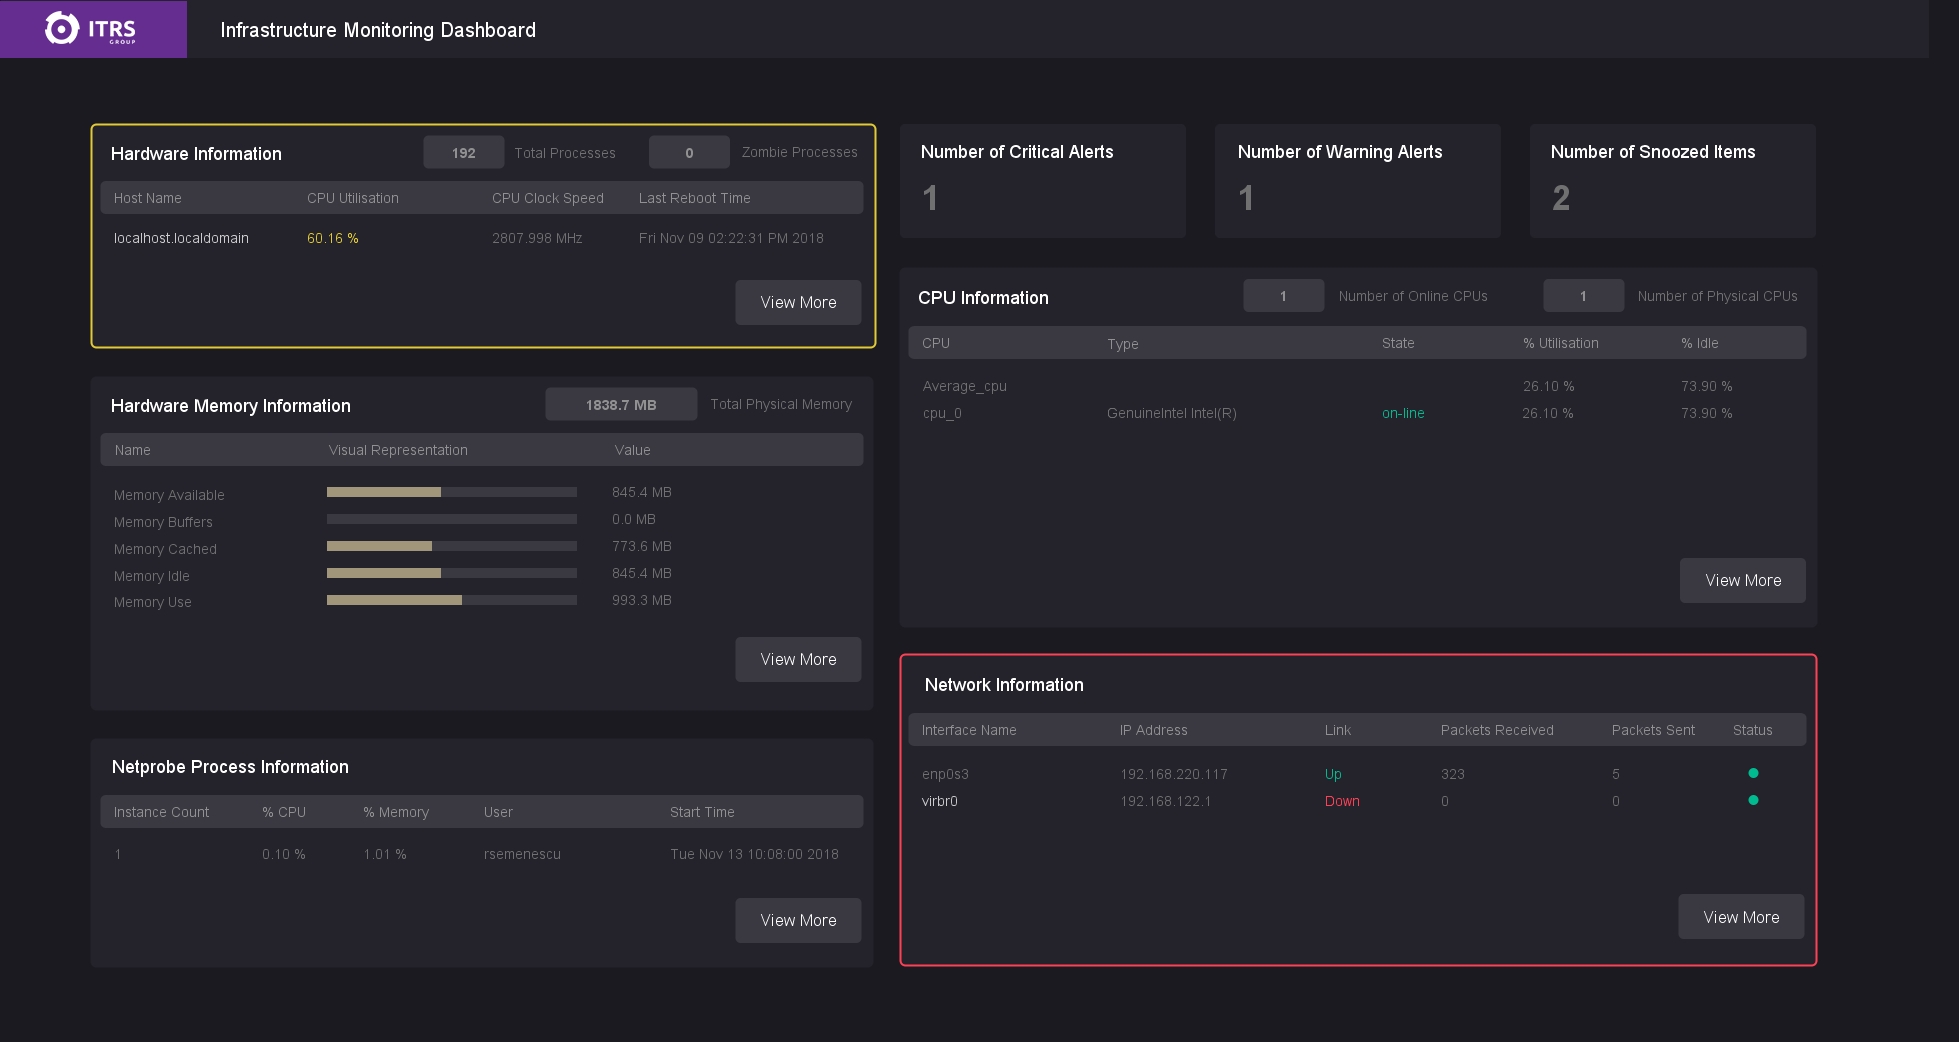
The Infrastructure Monitoring Dashboard is a simple, 'out of the box' dashboard template that can be used as a basis/starting point to create your own dashboards. The dashboard presents basic monitoring information such as CPU, Hardware or Network information, as well as total number of alerts and snoozed items. It is essential to note that the content represented here is Linux specific only.
Environment
This example dashboard has been designed to fit computer screens. It is not recommended to view it on a laptop or TV screen as achieving responsive design is not possible in Geneos.
Prerequisites
Clients must have a Linux probe up and running. They also need to download the files attached to this article (EXAMPLE-DB-Infrastructure-Monitoring.adb and EXAMPLE-DB-Infrastructure-Monitoring-Include-File.txt).
Setup Guide
Step 1 - Import the .adb file (EXAMPLE-DB-Infrastructure-Monitoring.adb) trough the Active Console and open it in the Active Dashboards dockable:
File -> Import -> Select your .adb file -> Active Dashboards -> Import
At this stage, the dashboard should look something like this:
The question marks indicate that the dashboard elements are pointing to invalid data items (non-existent data items, in this case - we have yet to create them).
Step 2 - Open the EXAMPLE-DB-Infrastructure-Monitoring-Include-File.txt and copy its content. Going back to the Active Console, open the Gateway Setup Editor and create a new include file:
1. Right-click Include -> New Include -> Set Priority to 100 -> Check Required Field -> Location: input the full path of the XML file you are creating (e. g. /opt/itrs/gateway/gateway_config/shared/infra_monitoring_dashboard.xml)
2. Expand the created file (click the '+' sign) -> Click to load... -> Yes
3. Click 'Gateway' -> Locate the drop-down menu in the top right corner of the window labeled as 'Normal' -> Select 'XML' from the list
4. Select all text (CTRL + a) and paste here the copied content from the EXAMPLE-DB-Infrastructure-Monitoring-Include-File.txt (CTRL + v)
Step 3 - Create or choose a managed entity on a Linux probe (either outside or inside the include file) and assign it the following types: Infrastructure Defaults for Dashboard and Dashboard Data.
Note: This configuration can be set up for one managed entity only. If this is set up for more than one managed entity, information will be picked up from multiple sources and so the layout of the dashboard will be automatically changed.
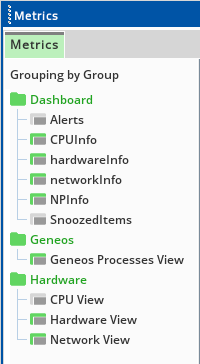
Step 4 - Save your work, exit the GSE and go back to your Active Console. Find your managed entity in the State Tree and select it. The Metrics dockable view selector should contain the following dataviews:

Dataviews under the Dashboard group represent custom views of the original data; the data provided by these samplers, as well as the Alerts and SnoozedItems samplers, is used within the dashboard creation.
Note: We were required to create these views in order to keep the XPaths as specific as possible and thus avoid having the dashboard pick up data from multiple sources.
Go to the Active Dashboards dockable. If these steps have been followed correctly, you should be able to see a fully functional dashboard (see picture below).

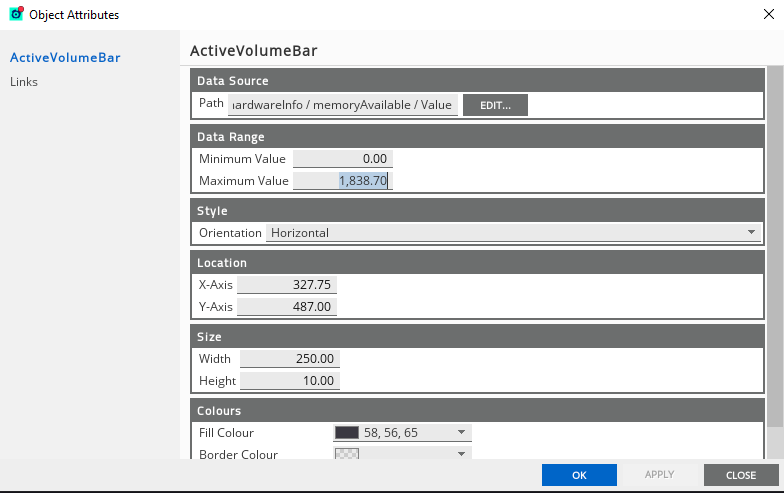
Note: The Hardware Memory Information bar chart functions based on a maximum value, which is the total Physical Memory value. As Geneos does not automatically update this value, it might be required to go through each of the 5 bar charts and manually replace it with the Total Physical Memory value:
Right-click on the bar chart -> Properties -> Change input of Maximum Value field -> OK

Next Steps
Clients can either keep this dashboard as it currently is, as an Infrastructure Monitoring dashboard, or change it completely to match more specific and own requirements (e. g. populate tables with different data sets, implement different data visualizations, create their own custom modifiers etc.).
Comments
0 comments
Please sign in to leave a comment.