|
NOTE: Most of these widgets rely on changes in the GA4.2 Active Console to set dashboard colours via RGB values defined in cells. Therefore the designer and end-users alike will need that version or later |
Objectives
The primary objective of this work is to stop the need to build dashboards from scratch, and thus increase the speed of deployment, and lower the requirements for specialist ITRS dashboard skill sets including graphic design concepts. This was always the vision for the Active Dashboard - that most users would not build tools from scratch. Much the design is therefore predicated on ease of use for the end-user, sometimes at the expense of the complexity of the design.
Assumptions
The following is assumed
- That you have write access to the required gateway
- That you have a working knowledge of SQL lite and the SQL plugin
- that you have a basic knowledge of ITRS dashboards
Installation
RELEASE NOTES
|
On a selected gateway you should add the following include file which contains the template drivers (samplers) for the various template dashboard components
templateDashboardDriversV6.xml
Then add the following tools to your workspace where you will build the dashboards
Upgrading
In the event that you are upgrading from a previous version of the template dashboards you should:
- Remove all the 'Template dashboard tools' from your workspace (the quickest way is to hold down CTRL, select them all then select 'Remove Tool'.
- Import the new toolset. Note that this will not affect (or upgrade) any instances of the tool you have on your dashboards. If you need to update these you will also need to remove the tool instances from the dashboard and drop them back on.
- Replace the XML include file with the new content. If you have customized this yourself, you will need to manually manage the updates.
General instructions
In general terms all these templates work the same way:
- Install the files described above
- Create a new Entity in the gateway
- Add an instance of one of the templated samplers in the XML file (listed in the installation instructions) and save the change
- Drag a populated row (or whole data view or entity if the instructions for the specific tool tell you so) onto your dashboard.
- Select the tool with the corresponding name. I.E. If you drag a row from the Metadata data view select the metadata tool.
All the templated samplers are GatewaySQL plugin views which come with hardcoded SQL allowing an example of the widget to be created. In order to make use of the widgets in a monitoring environment, you will need to modify the default Gateway SQL with your own, bringing in data from the remainder of the gateway. The specific values that each widget is expecting are discussed in the widget instructions below. For example, the basic Metadata widget may have the following:
SELECT
"Value 3" AS value,
"Units" AS units,
"Name 3" AS name,
2 AS severity
Meta Data Widget
This is a simple Metadata bar where each row is represented by a box and a title. The Box can have severity, and a textual unit definition if required. An example is shown below:

Sampler Name: Generic Meta Data Bar Driver
Tools:
|
Tool
|
Description
|
|---|---|
| Metadata Tool |
A single metadata box suitable for the dragged row, no title bar is included
|
| 12 Cell Metadata Bar |
A title bar and 12 metadata boxes, assuming rows 1-12 of the data view are present (otherwise will show blank metadata boxes for absent rows). The Title bar is driven by the rules in the gateway includes
|
| 8 Cell Meta Data Bar |
A title bar and 8 metadata boxes, assuming rows 1-12 of the data view are present (otherwise will show blank metadata boxes for absent rows). The Title bar is driven by the rules in the gateway includes |
Expected Drag operation: any populated row in the data view
The 3 tools create a single instance of a metadata tool, then a whole bar of metadata boxes (12 and 8 respectively). If the bars are used the title is also added. The expected SQL is as follows:
SELECT
"Value 3" AS value,
"Units" AS units,
"Name 3" AS name,
2 AS severity
The Value will replace the value element, the Units will replace the small units text (which can be left blank to remove it completely) while the name column will replace the 'Meta Data Name' at the bottom of the box. Text will be cropped in all cases. the severity color can be driven by changing the 'Severity' column which is expecting a value from 0-3. Both OK and undefined are shown as RGB 70,70,70.
If the metadata is coming from multiple sources (which is likely) then you may need to use a UNION ALL in your SQL lite, for example:
SELECT * FROM
(
SELECT
"Value 3" AS value,
"Units" AS units,
"Name 3" AS name,
2 AS severity

UNION ALL

SELECT
"Value 3" AS value,
"Units" AS units,
"Name 3" AS name,
2 AS severity

) examples
If you use UNION on its own duplicates will be removed.
The title of the metadata bar is driven by a rule in the XML, so can be changed directly from the gateway configuration
Generic Alert List Widget
The generic alert list drives a table-like view of alerts from the connected sampler. An example with a single row (alert) is shown below.
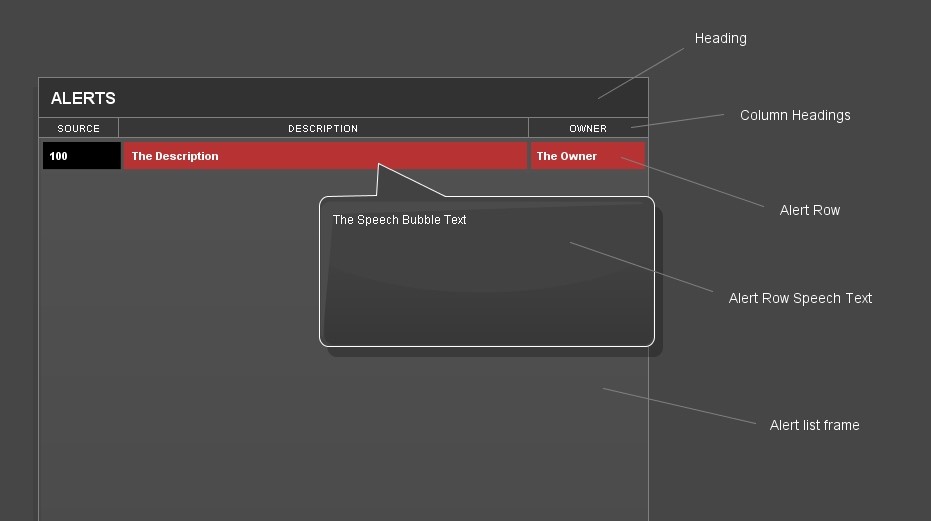
Sampler Name: Generic Alerting List Driver
Tools:
|
Tool
|
Description
|
|---|---|
| Alerting List | A simple list frame with no modifiers involved, suitable for use with the Generic Alerting Row |
| Generic Alerting Row | A single alerting row generated by a drag and drop operation of a row from the connected sampler |
| Full Alerting List | A complete widget with frame and all connected rows. |
Expected Drag operation: any row in the data view
While you can manually create this widget via the alerting list and Alerting row the suggestion is that you use the Full alerting list which will generate a widget capable of displaying up to 26 alerts. Each alert can a speech bubble appear if there is text in the speech bubble column. The Title heading and the column headings are all driven via the rules engine in the gateway so there should be no need to modify the widget once deployed. The list can be made smaller by grouping and removing lower rows. the following SQL is useful for displaying all rows at the same time
The effects are as follows
|
Field
|
Effect
|
|---|---|
| Reference | Populates the first column (black) with text, text will be clipped and not wrap, so keep this text short |
| Object | Currently not is use for this widget, so can be left blank |
|
Description |
Populates the description column (second column). The text will not wrap and will clip. If this text is blank the whole column will be hidden |
| The Owner | Populates the third column, the text will clip and not wrap |
| Score |
Float value. where:
The list needs to be ordered be byt score in the SQL ORDER BY score DESC |
| SpeechBubbleText |
Determines the text that will appear in the speech bubble. The text will wrap, but clip within the shape. If this cell is blank then the speech bubble will not appear. Designers are recommended to consider only using the speech bubble in the top row, but it will work on all rows. |
SLA Reporting bar
The SLA reporting bar demonstrates an SLA over time. It has contains
- A name (of the artifact to which the SLA applies)
- 3 volume bars, controlled as a percentage of the SLA bar width (the dark shaded back), the colours and widths are controllable via the gateway SQL
- A spark chart plotting the severity of the affected item
- A state of the object, the contents of which is determined by the designer of the SQL.
Sampler Name: SLA Tracking Bar Driver
Tools:
|
Tool
|
Description
|
|---|---|
| SLA bar | A single SLA Bar generated from dragging a fully populated row from the sampler. Note that the 'Name' column determines visibility, so if this is blank the SLA bar will not appear. |
Expected Drag operation: any populated row in the data view
This widget will create a single SLA Bar widget which plots the severity of the selected SLA on a spark chart across the middle of the bar. The chart appears as a yellow line with 3 step heights, low, medium and high, referencing OK or undefined, warning and critical. The severity is taken from the literal severity column in the same row. The name of the SLA is shown on the left-hand side, and its state is shown on the right. These are both determined by the designer of the SQL.
If the name of the SLA is "" then the whole bar will be rendered invisible.
Embedded in the tool are 3 volume bars that expand horizontally across the SLA bar. The value of these bars is assumed to be a percentage, expecting a range from 0-100. A value of 100 would fill the bar, and a value of 1 would render it invisible., The designer of the SLA can therefore determine their use, including making them invisible (by setting their value to 0). Note the bars are overlaid such that:
- Bar 3 (which is 100% opaque and therefore dominate) is on top
- Bar 2 is under bar 3
- Bar 1 is under bar 2
The colours of the bars are configurable via the SQL (documented below). Each bar also has a value tag in its bottom right, this shows one of two things:
- A user-definable tag (via the SQL)
- The percentage value if the user-definable tag is not defined.
The expected SQL is as follows:
SELECT

"name" AS name,
"State" AS state,
2 AS severity,
70 AS bar1Percent,
50 AS bar2Percent,
30 AS bar3Percent,
"" AS bar1endLabel,
"" AS bar2endLabel,
"" AS bar3endLabel,
"141,149,211" AS bar1MainColour,
"70,84,166" AS bar1GradColour,
"251,251,78" AS bar2MainColour,
"149,149,0" AS bar2GradColour,
"205,20,24" AS bar3MainColour,
"183,50,50" AS bar3GradColour
|
SQL Field
|
Effect
|
|---|---|
|
bar1endLabel |
The label that will appear in the bottom right of bar 1, if "" the percentage will be shown instead |
|
bar1GradColour |
The RGB value of the gradient fill in Bar 1, if the same as the fill colour the bar will have no gradient fill |
|
bar1MainColour |
The RGB value of bar 1 |
|
bar1Percent |
The percentage that bar 1 (the bottom bar) will fill the available shaded area, where 0 is no fill and 100 is fully filled. |
|
bar2endLabel |
The label that will appear in the bottom right of bar 2, if "" the percentage will be shown instead |
|
bar2GradColour |
The RGB value of the gradient fill in Bar 2, if the same as the fill colour the bar will have no gradient fill |
|
bar2MainColour |
The RGB value of bar 2 |
|
bar2Percent |
The percentage that bar 2 (the bottom bar) will fill the available shaded area, where 0 is no fill and 100 is fully filled. |
|
bar3endLabel |
The label that will appear in the bottom right of bar 3, if "" the percentage will be shown instead |
|
bar3GradColour |
The RGB value of the gradient fill in Bar 3, if the same as the fill colour the bar will have no gradient fill |
|
bar3MainColour |
The RGB value of bar 3 |
|
bar3Percent |
The percentage that bar 3 (the bottom bar) will fill the available shaded area, where 0 is no fill and 100 is fully filled. |
|
name |
The name that appears on the left-hand side of the SLA bar, note that if this is blank the entire bar will be rendered invisible |
|
severity |
The severity of the bar, which modifies the colour of the left and right-hand side panels, but not the volume bars, it expects a value from 0-3 on the standard severity scale |
|
state |
The text that appears on the right-hand side of the SLA bar |
In addition to the settings for the SLA bar that can and need to be configured via the GatewaySQL there are also a number of settings that can be modified via the gateway rules including:
- Bar Height
- Bar width
- Severity colours
- Transparency settings
Expanding Shape widget
This widget allows the designer to add a circle to the dashboard by defining its size and center coordinates. Aesthetic properties such as its border, transparency, and label are configurable directly via the SQL. An annotated example is shown below (note the widget adds just the circle, the other content is part of this instruction manual).
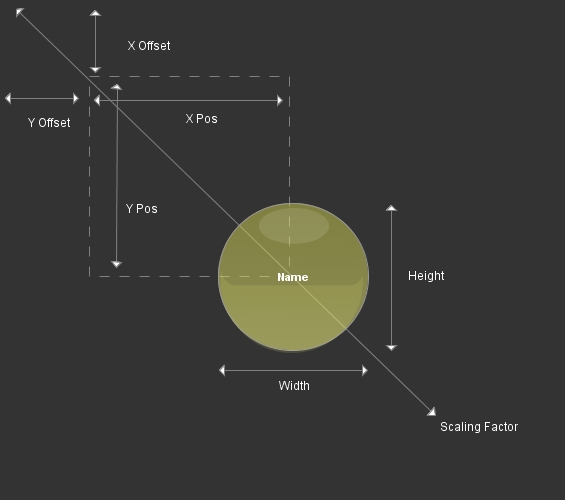
Sampler Name: Expanding Shape Driver
Tools:
|
Tool
|
Description
|
|---|---|
| Expandable Circle | A circle whose position and size will be determined by the SQL and gateway rules |
The Widget size and aesthetic is primarily defined by the SQL. The position is defined by a number of factors:
- The desired X position and Y position are defined by the SQL(assuming a 0,0 in the top left of the dashboard), This is a unit in pixels, and defines the center of the shape
- The Designer can also build in an X and Y offset in pixels, from which all positions are relative. This is in case you have a widget with many such shapes, allowing you to 'move' the 0,0 default. This is set via the rules in the gateway
- The scaling factor, which can be used during deployment if the zoom needs to be applied. This is set via the rules in the gateway
The SQL is as follows:
SELECT
"Name" AS name,
150 AS width,
150 AS height,
0.5 AS fillTransparancy,
1 AS borderTransparancy,
1 AS borderThickness,
2 AS severity,
200 AS xpos,
200 AS ypos
|
SQL Field
|
Effect
|
|---|---|
| name | the label that will appear in the center of the circle |
| width | width of the circle in pixels |
| height | height of the circle in pixels |
|
fillTransparancy |
How transparent the shape is from 0 (invisible) to 1 (opaque) |
|
borderTransparancy |
How transparent the border is from 0 (invisible) to 1 (opaque) |
| severity | assumed to have values from 0-3 (undefined, OK, warning, critical). The colours of the circle are derived from the severity |
| xpos | The x position of the center of the circle in pixels + any offset of scaling that is being applied |
| ypos | The y position of the center of the circle in pixels + any offset of scaling that is being applied |
European Volume Widget
This slightly specialized widget renders a European map where each country has a visual representation. The representation is a circle that can grow in size and transparency, change its severity color and its label via the connected SQL. Examples are shown below where all countries are rendered, and one where just the UK has been set as visible. The designer is left to decide things such as how big or small the circles can get, how transparent and whether they are visible at all.
This widget reuses the Expanding Shape widget.
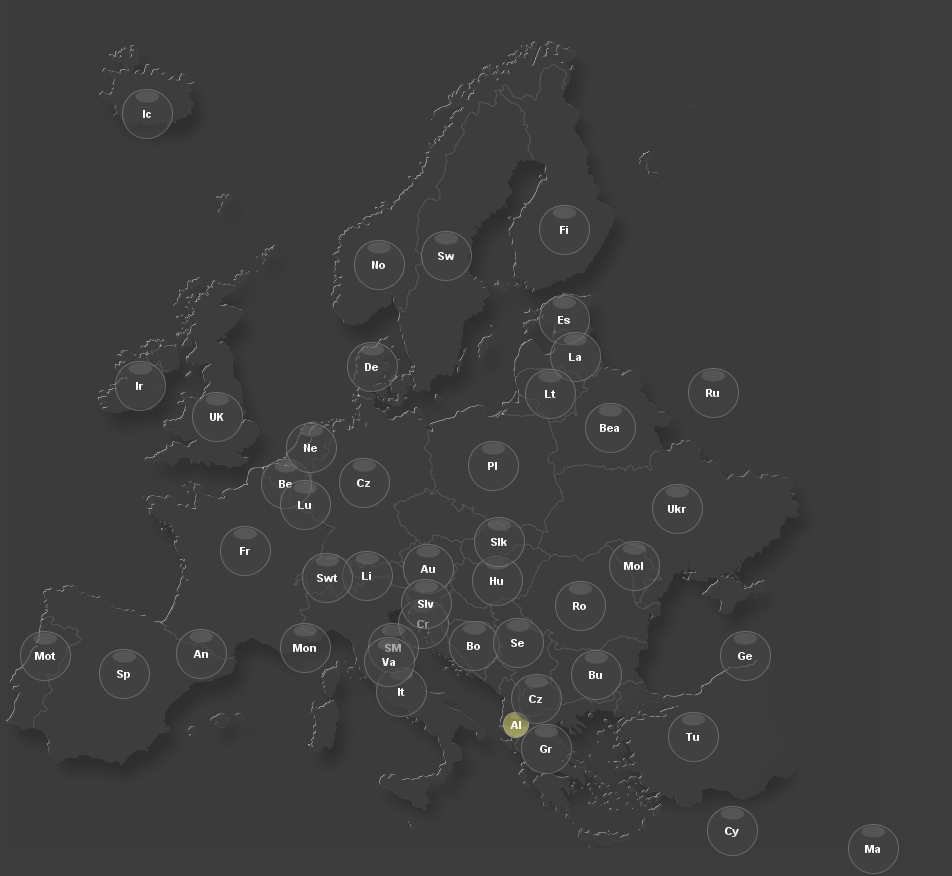
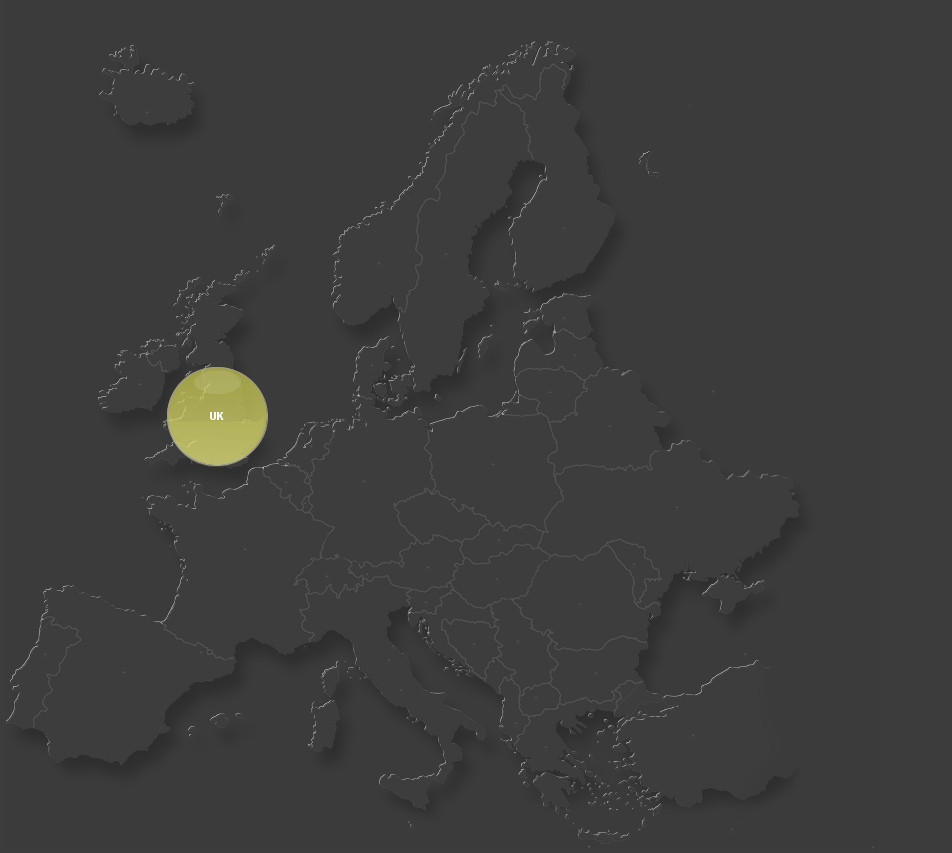
Sampler Name: European Volume Driver
Assumed background Colour: 59,59,59
Tools:
|
Tool
|
Description
|
|---|---|
| European Volume Widget | A full Europe map with a representation per country |
COALESCE(countriesOfInterest.name, NULL) AS name,

COALESCE(countriesOfInterest.width,5) AS width, -  width in pixels

COALESCE(countriesOfInterest.height,5) AS height, - height in pixels

COALESCE(countriesOfInterest.fillTransparancy, 0.01) AS fillTransparancy, - transparency from 0 to 1 (Transparent to Opaque)

COALESCE(countriesOfInterest.borderTransparancy, 0.01) AS borderTransparancy, - transparency from 0 to 1 (Transparent to Opaque)

1 AS borderThickness, - in pixels

COALESCE(countriesOfInterest.severity,1) AS severity - 0-3 scale, Undefined to critical
This essentially renders all country indicators invisible by default on the map. Changing these defaults will do so for all countries no overridden (see below for how to override specific countries).
The full SQL query is shown below. Next, we will talk about how to change the visuals for specific countries.
SELECT
c.countryID AS countryID,
c.country AS country,
c.xpos AS xpos,
c.ypos AS ypos,
COALESCE(countriesOfInterest.name, NULL) AS name,
COALESCE(countriesOfInterest.width,5) AS width,
COALESCE(countriesOfInterest.height,5) AS height,
COALESCE(countriesOfInterest.fillTransparancy, 0.01) AS fillTransparancy,
COALESCE(countriesOfInterest.borderTransparancy, 0.01) AS borderTransparancy,
1 AS borderThickness,
COALESCE(countriesOfInterest.severity,1) AS severity
FROM
(
SELECT * FROM
(
SELECT 1 AS countryID, "Albania" AS country, "Al" AS intials, 516 AS xpos, 725 AS ypos
UNION SELECT 2 AS countryID,"Andorra" AS country,"An" AS intials, 201 AS xpos, 654 AS ypos
UNION SELECT 4 AS countryID,"Austria" AS country,"Au" AS intials, 428 AS xpos, 569 AS ypos
UNION SELECT 5 AS countryID,"Belarus" AS country,"Bea" AS intials, 610 AS xpos, 428 AS ypos
UNION SELECT 6 AS countryID,"Belgium" AS country, "Be" AS intials, 286 AS xpos, 484 AS ypos
UNION SELECT 7 AS countryID,"Bosnia and Herzegovina" AS country,"Bo" AS intials, 474 AS xpos, 646 AS ypos
UNION SELECT 8 AS countryID,"Bulgaria" AS country,"Bu" AS intials, 596 AS xpos, 675 AS ypos
UNION SELECT 9 AS countryID,"Croatia" AS country,"Cr" AS intials, 423 AS xpos, 624 AS ypos
UNION SELECT 10 AS countryID,"Cyprus" AS country,"Cy" AS intials, 732 AS xpos, 831 AS ypos
UNION SELECT 12 AS countryID,"Denmark" AS country,"De" AS intials, 372 AS xpos, 367 AS ypos
UNION SELECT 13 AS countryID,"Estonia" AS country,"Es" AS intials, 564 AS xpos, 320 AS ypos
UNION SELECT 14 AS countryID,"Finland" AS country,"Fi" AS intials, 564 AS xpos, 230 AS ypos
UNION SELECT 15 AS countryID,"France" AS country,"Fr" AS intials, 245 AS xpos, 551 AS ypos
UNION SELECT 16 AS countryID,"Georgia" AS country,"Ge" AS intials, 745 AS xpos, 656 AS ypos
UNION SELECT 17 AS countryID,"Germany" AS country,"Cz" AS intials, 364 AS xpos, 483 AS ypos
UNION SELECT 18 AS countryID,"Greece" AS country,"Gr" AS intials, 546 AS xpos, 749 AS ypos
UNION SELECT 19 AS countryID,"Hungary" AS country,"Hu" AS intials, 497 AS xpos, 581 AS ypos
UNION SELECT 20 AS countryID,"Iceland" AS country,"Ic" AS intials, 147 AS xpos, 114 AS ypos
UNION SELECT 21 AS countryID,"Ireland" AS country,"Ir" AS intials, 140 AS xpos, 386 AS ypos
UNION SELECT 22 AS countryID,"Italy" AS country,"It" AS intials, 401 AS xpos, 692 AS ypos
UNION SELECT 25 AS countryID,"Latvia" AS country,"La" AS intials, 575 AS xpos, 357 AS ypos
UNION SELECT 26 AS countryID,"Liechtenstein" AS country,"Li" AS intials, 367 AS xpos, 576 AS ypos
UNION SELECT 27 AS countryID,"Lithuania" AS country,"Lt" AS intials, 550 AS xpos, 394 AS ypos
UNION SELECT 28 AS countryID,"Luxembourg" AS country,"Lu" AS intials, 305 AS xpos, 505 AS ypos
UNION SELECT 29 AS countryID,"Macedonia" AS country,"Cz" AS intials, 536 AS xpos, 699 AS ypos
UNION SELECT 30 AS countryID,"Malta" AS country,"Ma" AS intials, 873 AS xpos, 849 AS ypos
UNION SELECT 11 AS countryID,"Moldova" AS country,"Mol" AS intials, 634 AS xpos, 566 AS ypos
UNION SELECT 31 AS countryID,"Monaco" AS country,"Mon" AS intials, 305 AS xpos, 648 AS ypos
UNION SELECT 32 AS countryID,"Netherlands" AS country,"Ne" AS intials, 311 AS xpos, 448 AS ypos
UNION SELECT 33 AS countryID,"Norway" AS country,"No" AS intials, 379 AS xpos, 265 AS ypos
UNION SELECT 34 AS countryID,"Poland" AS country,"Pl" AS intials, 493 AS xpos, 466 AS ypos
UNION SELECT 35 AS countryID,"Portugal" AS country,"Mot" AS intials, 45 AS xpos, 656 AS ypos
UNION SELECT 36 AS countryID,"Romania" AS country,"Ro" AS intials, 580 AS xpos, 606 AS ypos
UNION SELECT 37 AS countryID,"Russia" AS country,"Ru" AS intials, 713 AS xpos, 393 AS ypos
UNION SELECT 38 AS countryID,"San Marino" AS country,"SM" AS intials, 393 AS xpos, 648 AS ypos
UNION SELECT 39 AS countryID,"Serbia" AS country,"Se" AS intials, 518 AS xpos, 643 AS ypos
UNION SELECT 40 AS countryID,"Slovakia" AS country,"Slk" AS intials, 499 AS xpos, 542 AS ypos
UNION SELECT 41 AS countryID,"Slovenia" AS country,"Slv" AS intials, 426 AS xpos, 604 AS ypos
UNION SELECT 42 AS countryID,"Spain" AS country,"Sp" AS intials, 124 AS xpos, 674 AS ypos
UNION SELECT 43 AS countryID,"Sweden" AS country,"Sw" AS intials, 446 AS xpos, 256 AS ypos
UNION SELECT 44 AS countryID,"Switzerland" AS country,"Swt" AS intials, 327 AS xpos, 578 AS ypos
UNION SELECT 45 AS countryID,"Turkey" AS country,"Tu" AS intials, 693 AS xpos, 737 AS ypos
UNION SELECT 46 AS countryID,"Ukraine" AS country,"Ukr" AS intials, 677 AS xpos, 509 AS ypos
UNION SELECT 47 AS countryID,"United Kingdom" AS country,"UK" AS intials, 217 AS xpos, 417 AS ypos
UNION SELECT 48 AS countryID,"Vatican City" AS country,"Va" AS intials, 389 AS xpos, 662 AS ypos

) listcountries
ORDER BY countryID
) c
LEFT OUTER JOIN
(
SELECT
"UK" AS name,
100 AS width,
100 AS height,
0.7 AS fillTransparancy,
1 AS borderTransparancy,
2 AS severity
) countriesOfInterest ON c.intials = countriesOfInterest.name
When you want country indicators to appear, and alter the indicators and visuals you need to eject your own SQL into the above, essentially replacing the following code:
SELECT
"UK" AS name,
100 AS width,
100 AS height,
0.7 AS fillTransparancy,
1 AS borderTransparancy,
2 AS severity
|
SQL field
|
Effect
|
|---|---|
| name | Chooses the country whose visuals you will override, this needs to be the same as the 'initials' defined in the country list. If you want to change the initials you need to change it in both places since this is how the join is performed in the SQL |
| width | Width in pixels of the indicator for that country |
| height | Height in pixels of the indicator for that country |
|
fillTransparancy |
The transparency for that indicator, where 0 is invisible and 1 is fully opaque |
|
borderTransparancy |
The border transparency for that indicator, where 0 is invisible and 1 is fully opaque |
| severity | on a scale of 0-3, equivalent to undefined, OK, Warning, Critical. |
The European volume widget is based on the Expanding shape widget above. This widget tackles one of the important issues of the coordinates from which the shapes (in this case the country visual indicators) are relative. By default, this will be the 0,0 coordinate of the dashboard. However, it is not realistic to assume that all such widgets will be placed in the very top left-hand corner of the dashboard. The Designer of the dashboard needs to thus tell the widget where its left-hand corner. To do this you need to override the xoffset and yoffset rules for your specific Volume widget instance. The default template dashboard rules are all defined at priority 1000, so this can be done by defining higher priority rules, for example
The Expanding shape widget also allows you to override the colors that represent the severities if the designer chooses, just override the following rules for your specific dashboard instance:
- Fill Colour
- Gradient Colour
Finally a word on the zooming. By overriding the following rule
- Scaling factor
For your specific dashboard, you can configure the map with the same zoom factor applied to the dashboard. For example, a zoom of 125% would require a zoom factor of 1.25.
Hex Grid Widget
The widget provides a grid of 70 hexagons whose aesthetic can be modified via the connected data view. This includes making them invisible, and thus allow the designer which hexes are visible at any given time. The founding principle is to allow users to create flow like diagrams, and therefore reduce the need to create such dashboards from scratch each time. An example of the grid is shown below, The basic Hex tool is also shipped should users wish to add more hexes or design new hex grids
Sampler Name: Hex Flow Grid Driver V1
Assumed background Colour: 59,59,59
Tools:
|
Tool
|
Description
|
|---|---|
| Hex Widget | A single hex (represented by a single row on the connected sampler |
| Hex Flow Widget | Adds the flow arrows to a single hex. This needs to be done separately because most of the time the user will always want the flow arrows over the top of all hexes. You should drag over the same row as you used to create the hex in the first place |
| Hex Flow Grid 1 | Recommended - A complete grid of 70 hexes preconfigured using the hex and hex flow tools. |
Expected Drag operation: any row in the data view
Hex configuration
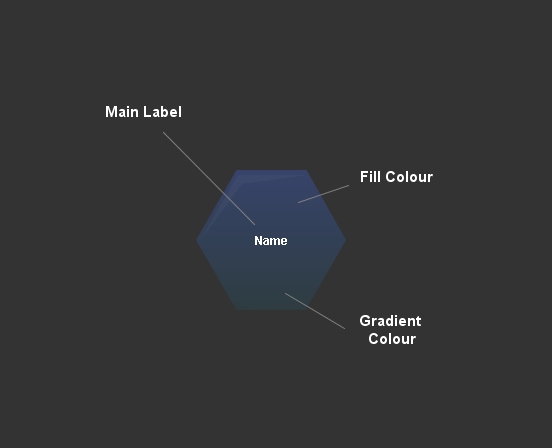
A basic Hex
has a label which is defined in the SQL as the 'Name' column. It also has a fill colour and a gradient fill colour. The fill colour is automatically determined within the widget by the severity column. However, the user can 'Override' this default with their own RGB values for both fill and gradient colour by setting via the gateway SQL the following:
- fillColour
- gradientColour
Adding Alerts
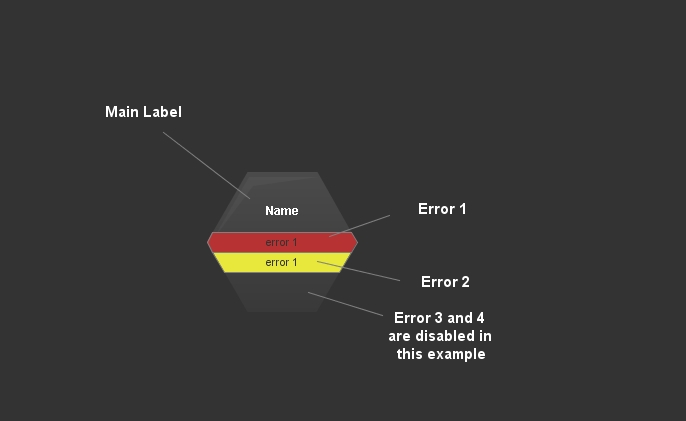
The user can add alerts to the hex as banners. there can be up to 4 of these, which can all of their own independent severity. If there are banners then the main label will move up to accommodate them. The errors will appear if the gatewaysql adds values to the following columns:
- "error 1" AS error1,
- "error 1" AS error2,
- "" AS error3,
- "" AS error4
In the example above the first two banners will appear, but the absence of a value for error 3 and 4 will keep them hidden.
Adding Metrics
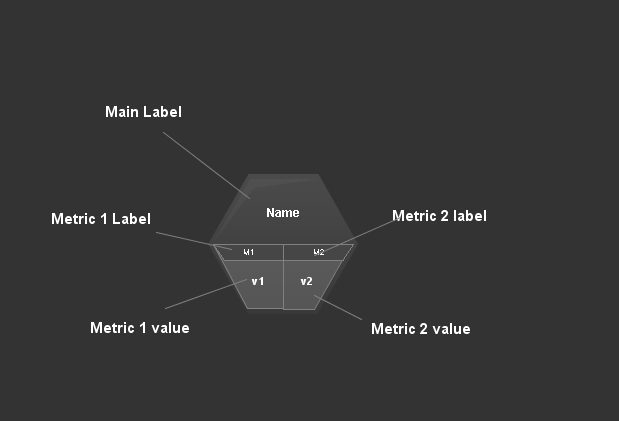
The user can also add up to 2 basic metrics to the hexes. These will appear if the following columns have non0null values
- "M1" AS metric1name
- "M2" AS metric2name
The values are set via these columns:
- "v1" AS metric1value,
- "v2" AS metric2value,
Note that should error banners also be included the error banners will take precedence
Adding Flow Arrows
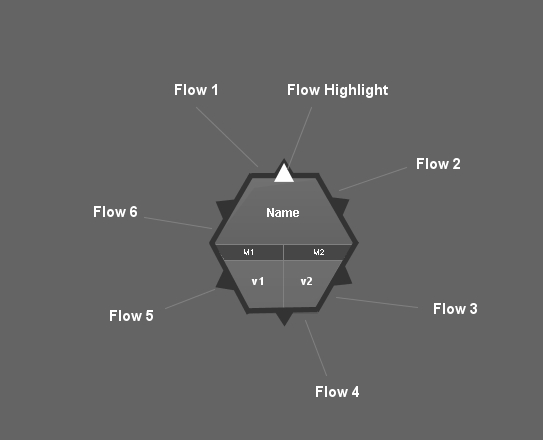
The User can add flow arrows from each of the Hexes edges. There are 6 flows, numbered 1 from 6, starting at the top and going clockwise. Each flow also has a 'highlight' which is a larger triangle that can be turned on as required. The user has influenced the transparency of the flows, and the colour of the highlight via the following columns:
- 1 AS flow1, (1 = the transparency from 0-1, where 1 is opaque)
- 1 AS flow1Highlight,
- "255,255,255" AS flow1HighlightColour,
- ... and then the same for the other flows
Because the flows need in almost all cases to be above all other hexes the Hex flow is a separate tool.
Grid layout and address space
If you use the full grid tool then when you use the Gateway SQL to alter the properties of the hexes, you will need to be able to select the hexes that you want to modify. Hexes are addressed from left to right as 1 through 14, and then from top to bottom as A-E. Thus the hex is the top corner is 1A, and the hex is the bottom right is 14E. Below is an example configuration of the hex grid, where the borders and names have been turned on to easily identify this address space.
The Hex defaults
The SQL defines the 70x70 grid of hexes, Hexes are referenced by their coordinates as described above. The defaults are defined in the coalesce statements at the top of the default gateway SQL.Chang9ing these will change the properties of all hexes that have not been explicitly overridden. For example to create the graphic above of all the hexes we changed the border Transparency and name.
COALESCE(hexesOfInterest.name, NULL) AS name, - name that appears in the hexThe remaining flows work the same way as flow 1:
COALESCE(hexesOfInterest.fillColour,NULL) AS fillColour, -,if set as an RGB value x,y,z, then it will override the severity colour of the hex
COALESCE(hexesOfInterest.gradientColour, NULL) AS gradientColour, -,if set as an RGB value x,y,z, then it will override the severity colour of the hex
COALESCE(hexesOfInterest.fillTransparancy, 0) AS fillTransparancy,- defaults to transparent (0), change from a value between 0-1 (1 = opaque)
COALESCE(hexesOfInterest.borderTransparancy, 0.1) AS borderTransparancy, - Defines the default transparency of the border. The value of 0.1 (on a scale of 0-1) means when the grid is created all hexes are visible. To turn off all non overridden hexes set this to 0.
COALESCE(hexesOfInterest.borderThickness, 1) AS borderThickness, - default border thickness in pixels
COALESCE(hexesOfInterest.severity, 0) AS severity, - default severity is undefined
COALESCE(hexesOfInterest.metric1name, "") AS metric1name, - If defined shows the first metric on the hex, which also pushes the main label up
COALESCE(hexesOfInterest.metric2name, "") AS metric2name, - the value of the first metric, note if set thus will display regardless of the state of the metric 1 title
COALESCE(hexesOfInterest.metric1value, "") AS metric1value, - If defined shows the second metric on the hex, which also pushes the main label up
COALESCE(hexesOfInterest.metric2value, "") AS metric2value, - the value of the second metric, note if set thus will display regardless of the state of the metric 2 title
COALESCE(hexesOfInterest.flow1, 0) AS flow1, - defines the transparency of the first flow, 0= invisible, 1 = opaque and any value in between
COALESCE(hexesOfInterest.flow1Highlight, 0) AS flow1Highlight, -defines the visibility of the larger arrow on the flow
COALESCE(hexesOfInterest.flow1HighlightColour, "255,255,255") AS flow1HighlightColour, - defines the colour of the default flow as an RGB value
 COALESCE(hexesOfInterest.flow2, 0) AS flow2,
 COALESCE(hexesOfInterest.flow2Highlight, 0) AS flow2Highlight,
 COALESCE(hexesOfInterest.flow2HighlightColour, "255,255,255") AS flow2HighlightColour,
 COALESCE(hexesOfInterest.flow3, 0) AS flow3,
 COALESCE(hexesOfInterest.flow3Highlight, 0) AS flow3Highlight,
 COALESCE(hexesOfInterest.flow3HighlightColour, "255,255,255") AS flow3HighlightColour,
 COALESCE(hexesOfInterest.flow4, 0) AS flow4,
 COALESCE(hexesOfInterest.flow4Highlight, 0) AS flow4Highlight,
 COALESCE(hexesOfInterest.flow4HighlightColour, "255,255,255") AS flow4HighlightColour,
 COALESCE(hexesOfInterest.flow5, 0) AS flow5,
 COALESCE(hexesOfInterest.flow5Highlight, 0) AS flow5Highlight,
 COALESCE(hexesOfInterest.flow5HighlightColour, "255,255,255") AS flow5HighlightColour,
 COALESCE(hexesOfInterest.flow6, 0) AS flow6,
 COALESCE(hexesOfInterest.flow6Highlight, 0) AS flow6Highlight,
 COALESCE(hexesOfInterest.flow6HighlightColour, "255,255,255") AS flow6HighlightColour,


 COALESCE(hexesOfInterest.error1Severity, 0) AS error1Severity, - Defines the severity of the first alert banner
 COALESCE(hexesOfInterest.error1, "") AS error1, - defines the text in the first alert banner
The remaining alerts work the same way as alerts 1:
 COALESCE(hexesOfInterest.error2Severity, 0) AS error2Severity,
 COALESCE(hexesOfInterest.error2, "") AS error2,
 COALESCE(hexesOfInterest.error3Severity, 0) AS error3Severity,
 COALESCE(hexesOfInterest.error3, "") AS error3,
 COALESCE(hexesOfInterest.error4Severity, 0) AS error4Severity,
 COALESCE(hexesOfInterest.error4, "") AS error4
The Default SQL
The SQL is in 3 main parts, the Coalesce statements, which define the defaults, the hex definitions, and the hex override statements, where users can define the hexes they want visible and their properties.
Defining your own hexes
To 'Override' the hex defaults and therefore start to use the grid for your own ends you need to modify the SQL at the bottom of the statement. An example is shown below
SELECT
"2A" AS ofintrest,
"Name" AS name,
1 AS severity,

"63,104,232" AS fillColour, "33,81,97" AS gradientColour, 0.3 AS fillTransparancy,
0 AS borderTransparancy, 1 AS borderThickness,

"" AS metric1name, "" AS metric1value,
"" AS metric2name, "" AS metric2value,

0 AS flow1, 0 AS flow1Highlight, "255,255,255" AS flow1HighlightColour,
0 AS flow2, 0 AS flow2Highlight, "255,255,255" AS flow2HighlightColour,
0 AS flow3, 0 AS flow3Highlight, "255,255,255" AS flow3HighlightColour,
0 AS flow4, 0 AS flow4Highlight, "255,255,255" AS flow4HighlightColour,
0 AS flow5, 0 AS flow5Highlight, "255,255,255" AS flow5HighlightColour,
0 AS flow6, 0 AS flow6Highlight, "255,255,255" AS flow6HighlightColour,

2 AS error1Severity, "" AS error1,
2 AS error2Severity, "" AS error2,
2 AS error3Severity, "" AS error3,
2 AS error4Severity, "" AS error4
Tree View List Widget
This widget provides a list, in which rows can be indented to mimic a hierarchy of data. I.E. a heading 1 row, then a heading 2 rows, a few rows of data, then another row 2 and so on. To maximise reusability it also allows between 1-4 columns of data, depending on the designer's requirements.
Sampler Name: Tree List Driver V1
Assumed background Colour: Dark background preferred, the backdrop of the list is opaque so its not super important.
Tools:
|
Tool
|
Description
|
|---|---|
| Tree List Row V1 | A single row for a Tree View List, minus a divider. |
| Tree List Row With Divider V1 | A single Tree List Row with an inbuilt divider |
| Tree List Widget V1 | Recommended - A complete list with 30 rows with no gaps between the rows |
| Tree List Widget With Dividers V1 | Recommended - A complete list with 30 rows, all with dividers (and therefore spaces in between the rows |
Turning on basic columns
Columns will appear if you have defined text in the respective cells (Col1Text, Col2Text and so on). Inserts will be added to separate the column data automatically. An example can be seen in the figure below.
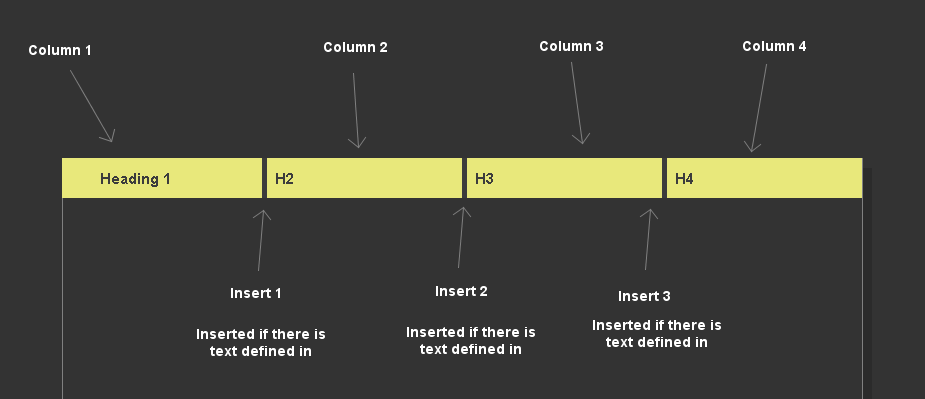
The source XML is as follows for the above view:
SELECT
1 AS "Indent Level",
0 AS "Border Transparancy",
"" AS "Border Colour",
"Heading 1" AS "Col1Text",
"H2" AS "Col2Text",
"H3" AS "Col3Text",
"H4" AS "Col4Text",
2 AS severity,
"" AS "fillColour",
"" AS "Fill Transparancy",
"" AS "Font Colour",
"128,128,128" AS "divider fill colour",
1 AS "divider Transparancy",
"wwwpage(http://www.bbc.co.uk)" AS "Hyperlink"
If you leave a text cell blank then the previous column will expand across to the next column. An example is shown below:
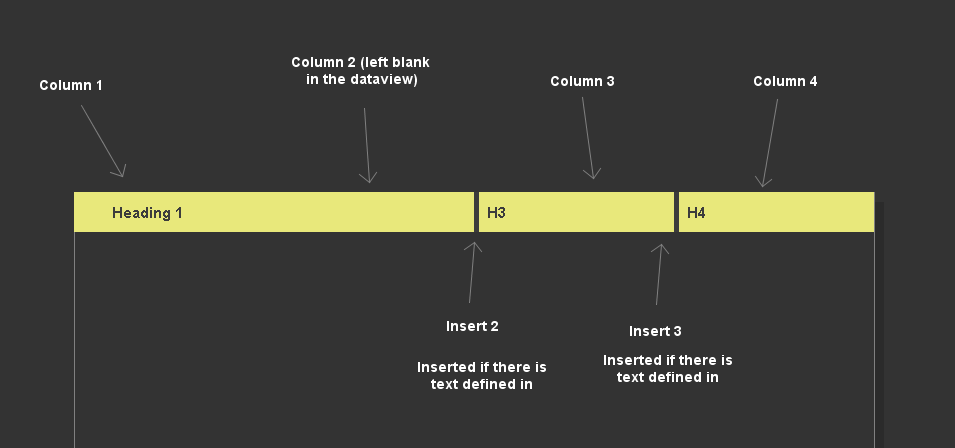
SELECT
1 AS "Indent Level",
0 AS "Border Transparancy",
"" AS "Border Colour",
"Heading 1" AS "Col1Text",
"" AS "Col2Text",
"H3" AS "Col3Text",
"H4" AS "Col4Text",
2 AS severity,
"" AS "fillColour",
"" AS "Fill Transparancy",
"" AS "Font Colour",
"128,128,128" AS "divider fill colour",
1 AS "divider Transparancy",
"wwwpage(http://www.bbc.co.uk)" AS "Hyperlink"

SELECT
1 AS "Indent Level",
0 AS "Border Transparancy",
"" AS "Border Colour",
"Heading 1" AS "Col1Text",
"" AS "Col2Text",
"" AS "Col3Text",
"" AS "Col4Text",
2 AS severity,
"0,198,192" AS "fillColour",
"" AS "Fill Transparancy",
"255,255,255" AS "Font Colour",
"128,128,128" AS "divider fill colour",
1 AS "divider Transparancy",
"wwwpage(http://www.bbc.co.uk)" AS "Hyperlink"

UNION

SELECT
2 AS "Indent Level",
0 AS "Border Transparancy",
"" AS "Border Colour",
"Heading 2" AS "Col1Text",
"" AS "Col2Text",
"" AS "Col3Text",
"" AS "Col4Text",
1 AS severity,
"80,80,80" AS "fillColour",
"" AS "Fill Transparancy",
"255,255,255" AS "Font Colour",
"128,128,128" AS "divider fill colour",
1 AS "divider Transparancy",
"wwwpage(http://www.bbc.co.uk)" AS "Hyperlink"

UNION

SELECT
3 AS "Indent Level",
0 AS "Border Transparancy",
"" AS "Border Colour",
"Col 1" AS "Col1Text",
"Col 2" AS "Col2Text",
"Col 3" AS "Col3Text",
"Col 4" AS "Col4Text",
2 AS severity,
"" AS "fillColour",
"" AS "Fill Transparancy",
"" AS "Font Colour",
"128,128,128" AS "divider fill colour",
1 AS "divider Transparancy",
"wwwpage(http://www.bbc.co.uk)" AS "Hyperlink"
Table column headings:

SELECT
0 AS "Indent Level",
1 AS "Border Transparancy",
"" AS "Border Colour",
"Heading 1" AS "Col1Text",
"H2" AS "Col2Text",
"H3" AS "Col3Text",
"H3" AS "Col4Text",
0 AS severity,
"70,70,70" AS "fillColour",
"" AS "Fill Transparancy",
"255,255,255" AS "Font Colour",
"128,128,128" AS "divider fill colour",
1 AS "divider Transparancy",
"wwwpage(http://www.bbc.co.uk)" AS "Hyperlink"
UNION ALL
SELECT
0 AS "Indent Level",
0 AS "Border Transparancy",
"" AS "Border Colour",
"V1" AS "Col1Text",
"V2" AS "Col2Text",
"V3" AS "Col3Text",
"V4" AS "Col4Text",
2 AS severity,
"" AS "fillColour",
"" AS "Fill Transparancy",
"" AS "Font Colour",
"60,60,60" AS "divider fill colour",
1 AS "divider Transparancy",
"wwwpage(http://www.bbc.co.uk)" AS "Hyperlink"
The effects are as follows:
|
Field
|
Effect
|
|---|---|
| Indent Level |
A value from 0-4.
|
| Border Transparancy | Defined the transparancy of the borders, set 0 for invisible, and 1 for opaque |
|
Border Colour |
The colour of the borders (if visible) |
| Column 1 Text | The text in the first column. Note that this text also defines the visibility of the row. If the text is "" then the row will not display at all |
| Column 2 Text |
The Text in the second column, if set then a divider will be added between the first and second column and the previous column text will be trucated. Set to "" to not use it |
| Column 3 Text |
The Text in the third column, if set then a divider will be added between the second and third column and the previous column text will be trucated. Set to "" to not use it |
| Column 4 Text | The Text in the Fourth column, if set then a divider will be added between the third and fourth column and the previous column text will be trucated. Set to "" to not use it |
| Severity | The severity of the row. This will determine its colour unless you have overridden it. It is expecting a value from 0-3 |
| Fill Colour | The fill colour of the row, this will override the severity colour, expects an RGB value, I.E. "255,255,255" |
| Font Colour | The font colour of the row, this will override the severity colour, expects an RGB value, I.E. "255,255,255" |
| Divider Fill Colour | The colour of the divider under the row, set "60,60,60" to make it the same as the background colour |
| Divider Transparancy | The transparabcy of the divider under the row (0-1, where 0 is transparanat) |
| Hyperlink | The hyperlink that will be invoked if you click on the row) |
Ideas for next widgets
- Monitoring of the monitoring
- Table view (Complete data view)
- Gateway Load
- Universal plugins maybe based on Managed Entity Type
Comments
0 comments
Please sign in to leave a comment.