 |
The following steps allow you to create (most) of a dataview quickly.
- Add a new rectangle to a dashboard and make it the correct size of a (table) cell that you want to appear in your dashboard dataview
- Configure the visual properties of your rectangle to be as you want for the table. In general, this will involve changing the font and border colour or fill transparency.
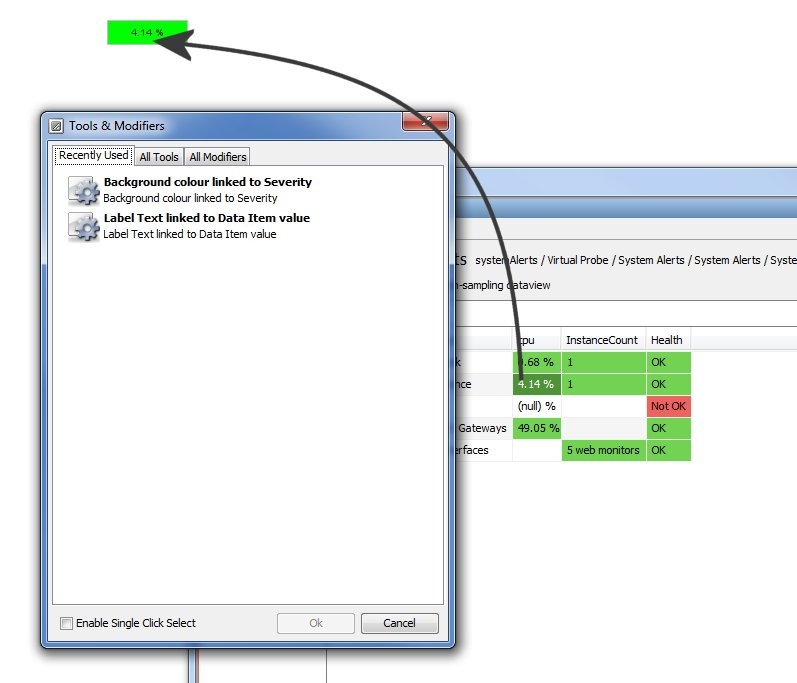
- Drag and drop any cell onto your new rectangle, when the dialog comes up select the 'Background colour linked to Severity' and 'Label Text linked to Data Item value' modifiers.
- the cell should show the colour and value of the selected cell

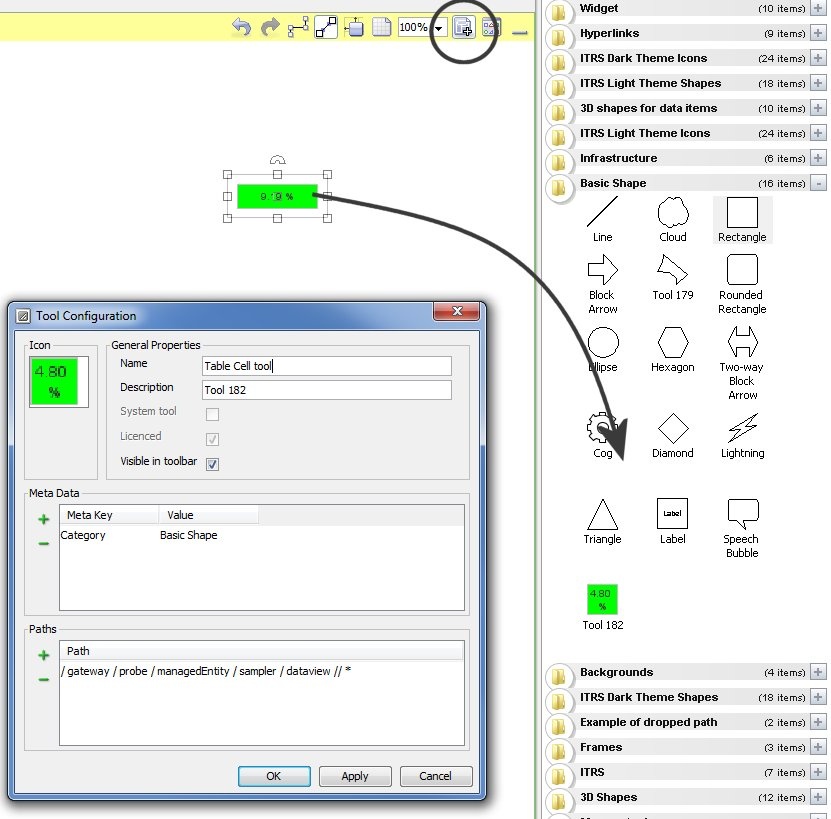
- Next switch into the Tool Creation Mode on the dashboard, and drag and drop your new rectangle into the palette, give it the name 'Table Cell tool'

- You can delete the rectangle that you created once the tool exists, or leave it as you see fit.
- Now go to the dataview that you want to put onto the dashboard and select all the cells (hold down the shift key and select the top left and bottom right cells), then drag and drop all the cells into the dashboard
- Once the dialog appears (which may take a few seconds because of the number of items you are dropping at once), select your new 'Table Cell Tool' from the list of tools
- The row names have to be added manually after this. This is because the row name itself is not a data item, so cannot be referenced by an Xpath.
|


Comments
0 comments
Please sign in to leave a comment.