Naemon or OP5 Monitor logs can be ingested into Log Analytics to perform data searches, visualizations, and analytics. This article aims to guide a user with integrating Monitor-created logs into a Log Analytics environment.
|
Pre-requisites You will need a working ITRS OP5 Monitor and ITRS Log Analytics installation along with root access. Filebeat will also be necessary; for open-source versions of Elasticsearch, use Filebeat OSS. Some relevant integration files are located in \install\Agents\op5integration\naemonLogs directory of the tarball for Log Analytics releases. |
ITRS OP5 Monitor Setup
The basics
- Import the rpm to the Monitor host.
- Install the rpm:
yum install filebeat-oss-6.6.0-x86_64.rpm - Enable the service:
sudo systemctl enable filebeat
Filebeat setup
First, the following fields need to be setup in /etc/filebeat/filebeat.yml:
In section Filebeat inputs, set and/or add the following:
# Paths that should be crawled and fetched. Glob based paths.
paths:
 - /opt/monitor/var/naemon.log

filebeat.config.inputs:
 enabled: true
 path: configs/*.yml
More log files to parse can be added by following the same syntax as above, and identifying the path to the log file.
In section Logstash output, set and/or add:
hosts: ["192.168.xx.xx:5044"]
username: logstash
password: logstash
The hosts field follows the following syntax: hosts: ["LOGSTASH_IP:FILEBEAT_PORT"]. LOGSTASH_IP would then refer to the IP address of where your Log Analytics installation is, while the FILEBEAT_PORT could be any available port (the default is 5044). The username and password fields may vary depending on how your Logstash installation was setup.
Multiple Logstash instances can also be published to by defining: hosts: ["IP_1:PORT_1", "IP_2:PORT_2", "IP_3:PORT_3"] and so on.
To aid with potential problems (such as Filebeat cannot talk to Logstash), logging can be enabled from the Filebeat side to see what is happening. In the Logging section, add:
# Sets log level. The default log level is info.
# Available log levels are: error, warning, info, debug
logging.level: debug
logging.to_files: true
logging.files:
 path: /var/log/filebeat
 name: filebeat
 keepfiles: 7
 permissions: 064
Logging is quite verbose and may end up using a lot of storage. Set logging.level to error to minimize storage footprint or disable logging entirely once setup has been completed.
Second, the filebeats catalog needs to be created.
- Create the catalog directory:
mkdir /etc/filebeat/configs - Upload and/or move the naemon_logs.yml file to the
configsdirectory.
The following commands can be run to test the configuration. The output should be similar to below:
[root@op5-system ~]# /usr/share/filebeat/bin/filebeat --path.config /etc/filebeat/ test config
Config OK
[root@op5-system ~]# /usr/share/filebeat/bin/filebeat --path.config /etc/filebeat/ test output
logstash: 192.168.xx.xx:5044...
 connection...
 parse host... OK
 dns lookup... OK
 addresses: 192.168.xx.xx
 dial up... OK
 TLS... WARN secure connection disabled
 talk to server... O
Finally, restart Filebeat for configuration to reload
sudo systemctl restart filebeat .
ITRS Log Analytics Setup
Logstash setup
First, copy the naemon file to /etc/logstash/patterns.d directory.
The naemon file is a grok file that essentially tells Logstash how to process the ingested log data. This also normalizes the data from a flat log file into something more structured that can be manipulated within the ELK stack. Here is a great article on grok and Logstash.
Second, upload and/or move the op5naemon_beat.conf file to the /etc/logstash/conf.d/ directory.
Fields of interest are: port in the input block, hosts, username , and password in the output block. Host details can be set to localhost:9200, since Logstash is setup to forward information to Elasticsearch within the same environment. Port 9200 is the default for Elasticsearch.
The output block can be amended as well depending on how much data is to be ingested. For the else block, we can choose to dump everything to an "op5-naemon" index. What is defined in the configuration below, though, creates indices per day, making managing data from large environments more manageable.
The patterns_dir field should be populated with the directory where the grok patterns file is located. The op5naemon_beat.conf file should look something similar to:
input {
 beats {
 port => 5044
 }
}

filter {
 if "op5naemon" in [tags] {
 grok {
 patterns_dir => [ "/etc/logstash/patterns.d" ]
 match => { "message" => "%{NAEMONLOGLINE}" }
 remove_field => [ "message" ]
 }
 date {
 match => [ "naemon_epoch", "UNIX" ]
 target => "@timestamp"
 remove_field => [ "naemon_epoch" ]
 }
 }
}

output {
 # Separate indexes
 if "op5naemon" in [tags] {
 if "_grokparsefailure" in [tags] {
 elasticsearch {
 hosts => ["127.0.0.1:9200"]
 index => "op5-naemongrokfailure"
 user => "logserver"
 password => "logserver"
 }
 }
 else {
 elasticsearch {
 hosts => ["127.0.0.1:9200"]
 index => "op5-naemon-%{+YYYY.MM.dd}"
 user => "logserver"
 password => "logserver"
 }
 }
 }
}
The naemon file may need logstash:logstash ownership as well as rwx------ permissions.
Finally, restart Logstash for configuration to reload:
sudo systemct restart logstash
Elasticsearch setup
First, upload and/or move the naemon_template.sh to the Log Analytics environment.
This file does not have execute permissions, so make the necessary changes needed.
Second, amend the script to include your Kibana login credentials
The script does not have this and you may run into an authorization error. Note that the credentials are the ones used to access the web UI, not the ones to access the CLI.
For example, change curl -XPUT "localhost:9200/_template/naemon" etc... to curl -u username:password -XPUT "localhost:9200/_template/naemon" etc.... The resulting file should look something similar to:
#!/bin/bash

curl -u logserver:logserver -XPUT "localhost:9200/_template/naemon" -H'Content-Type: application/json' -d'{
 "index_patterns": ["op5-naemon-*"],
 "order": 1,
 "settings": {
 "number_of_shards": 5,
 "auto_expand_replicas": "0-1"
 },
 "mappings": {
 "doc": {
 "properties": {
 "naemon_type": {
 "type": "keyword"
 },
 "naemon_hostname": {
 "type": "keyword"
 },
 "naemon_service": {
 "type": "keyword"
 }
 }
 }
 }
}'
According to the documentation, "if you have a default pattern covering settings section you should delete/modify that in naemon_template.sh."
Lastly, you may need to restart Filebeat on the Monitor side to get the index to be created on Elasticsearch.
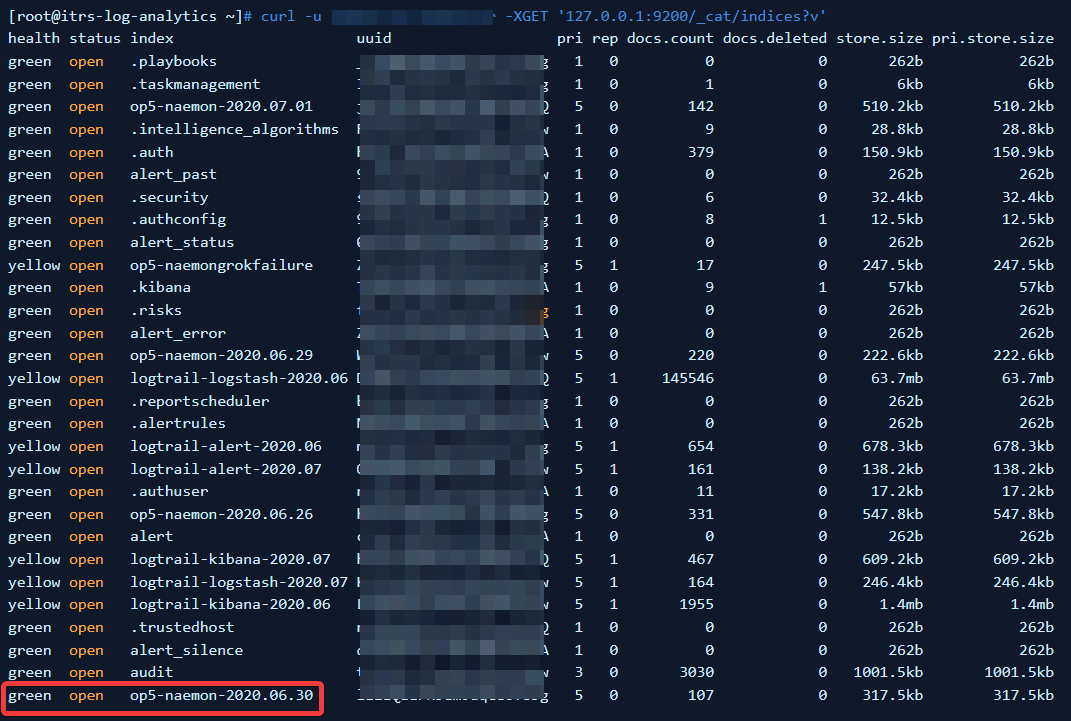
You can verify index creation by running curl -u username:password -XGET '127.0.0.1:9200/_cat/indices?v' on the Elasticsearch environment. If the index/indices was/were created, they should be under the 'index' field of the command's output with the format op5-naemon-yyyy.mm.dd:

Comments
0 comments
Please sign in to leave a comment.